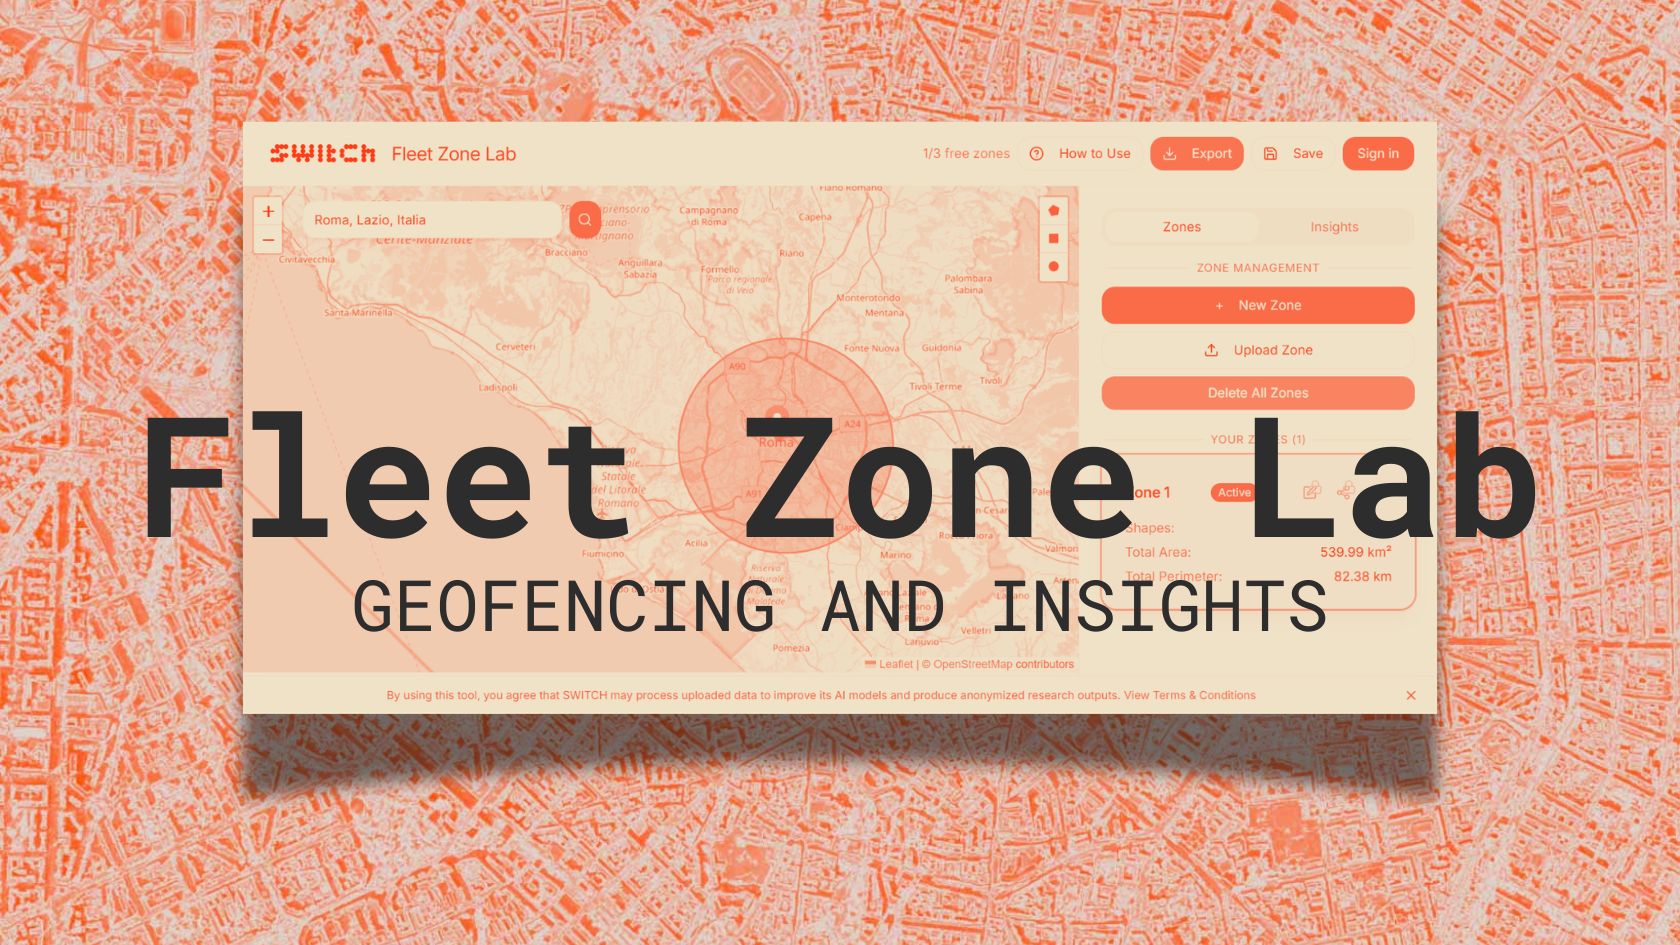
Most mapping tools tell you where things are. Fleet Zone Lab tells you what’s in your area: the moment you draw it.
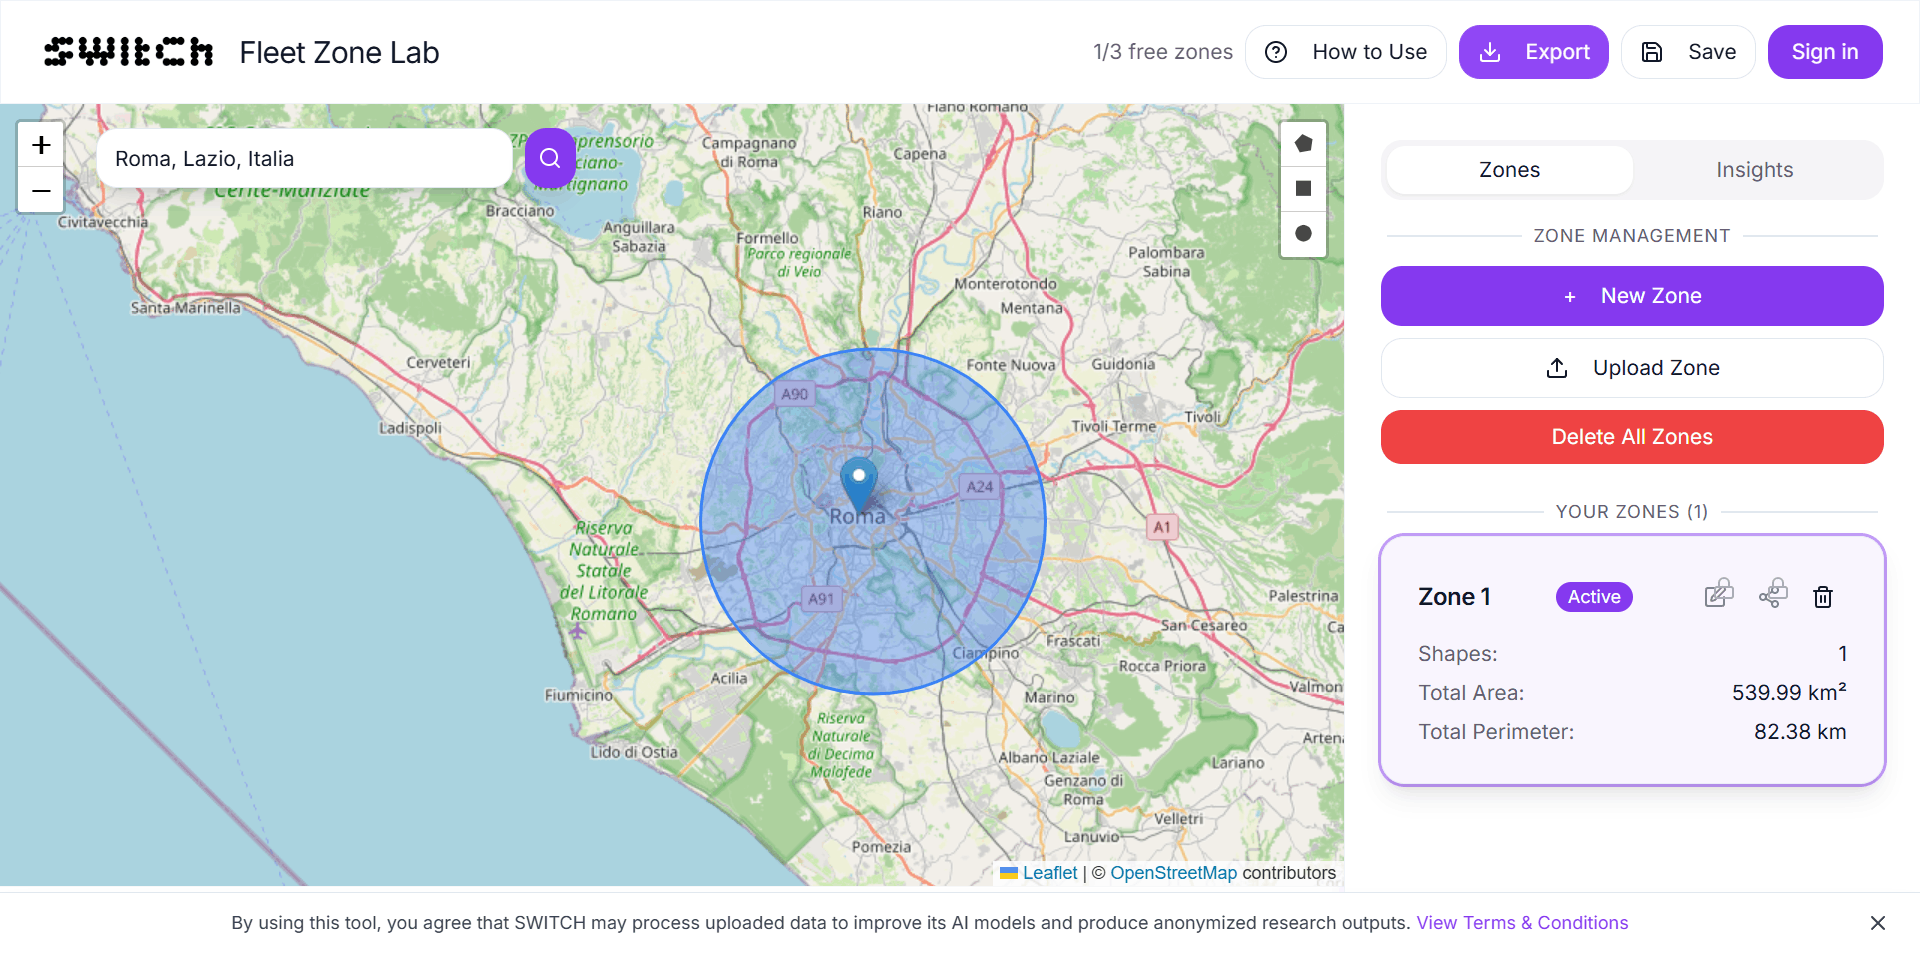
Drop a zone on the map, upload an existing file, or paste coordinates. In seconds you get the area in km², the perimeter, and a live count of everything inside: public transport stops, points of interest, and EV charging stations. No account required. No software to install. No waiting.
That’s it. That’s the tool.
What Fleet Zone Lab actually does
You draw a polygon. Or upload a GeoJSON, KML, or Shapefile. Or load an area you’ve used before.
The tool then runs three analyses simultaneously:
- Area and perimeter: exact km² and km of boundary, calculated the moment you close the shape
- Infrastructure density: how many public transport stops (bus, tram, metro) fall inside your zone
- Points of interest: commercial locations, services, and amenities within the boundary
- EV charging stations: public charging points inside the zone, useful for electrification planning
The results update live as you reshape the zone. No button to click, no export to wait for.
Who uses it and what for
Fleet Zone Lab was built for anyone who needs to understand a geographic area fast, without a GIS background or a paid subscription.
Operations and logistics teams use it to check whether a delivery zone or service area has the infrastructure to support their operations, before committing vehicles or staff to it.
Mobility startups and consultants use it to validate new markets. Draw a candidate city or district, read the infrastructure signals, compare two zones side by side. It’s a faster first pass than any GIS workflow.
Urban planners and analysts use it to get a quick infrastructure snapshot for a defined area, useful for reports, presentations, and initial feasibility checks before deeper analysis.
If your work ever involves the question “what’s in this area?”, Fleet Zone Lab is for you.
What’s free and what unlocks when you register
Fleet Zone Lab is free to open and use. You can draw zones, upload files, and read the core metrics without creating an account.
Registering unlocks Detailed Analytics: deeper infrastructure breakdowns, the ability to save and reload zones, and data export for use in reports and presentations.
If you’re doing a one-off check, start without an account. If you’re running recurring analysis or need to share results, registration takes under a minute.
How to run your first zone analysis: step by step
You don’t need a tutorial. But here’s what the first 3 minutes look like.
Step 1: Open the tool
Go to area-analyst.getswitch.io.
No login required to start.
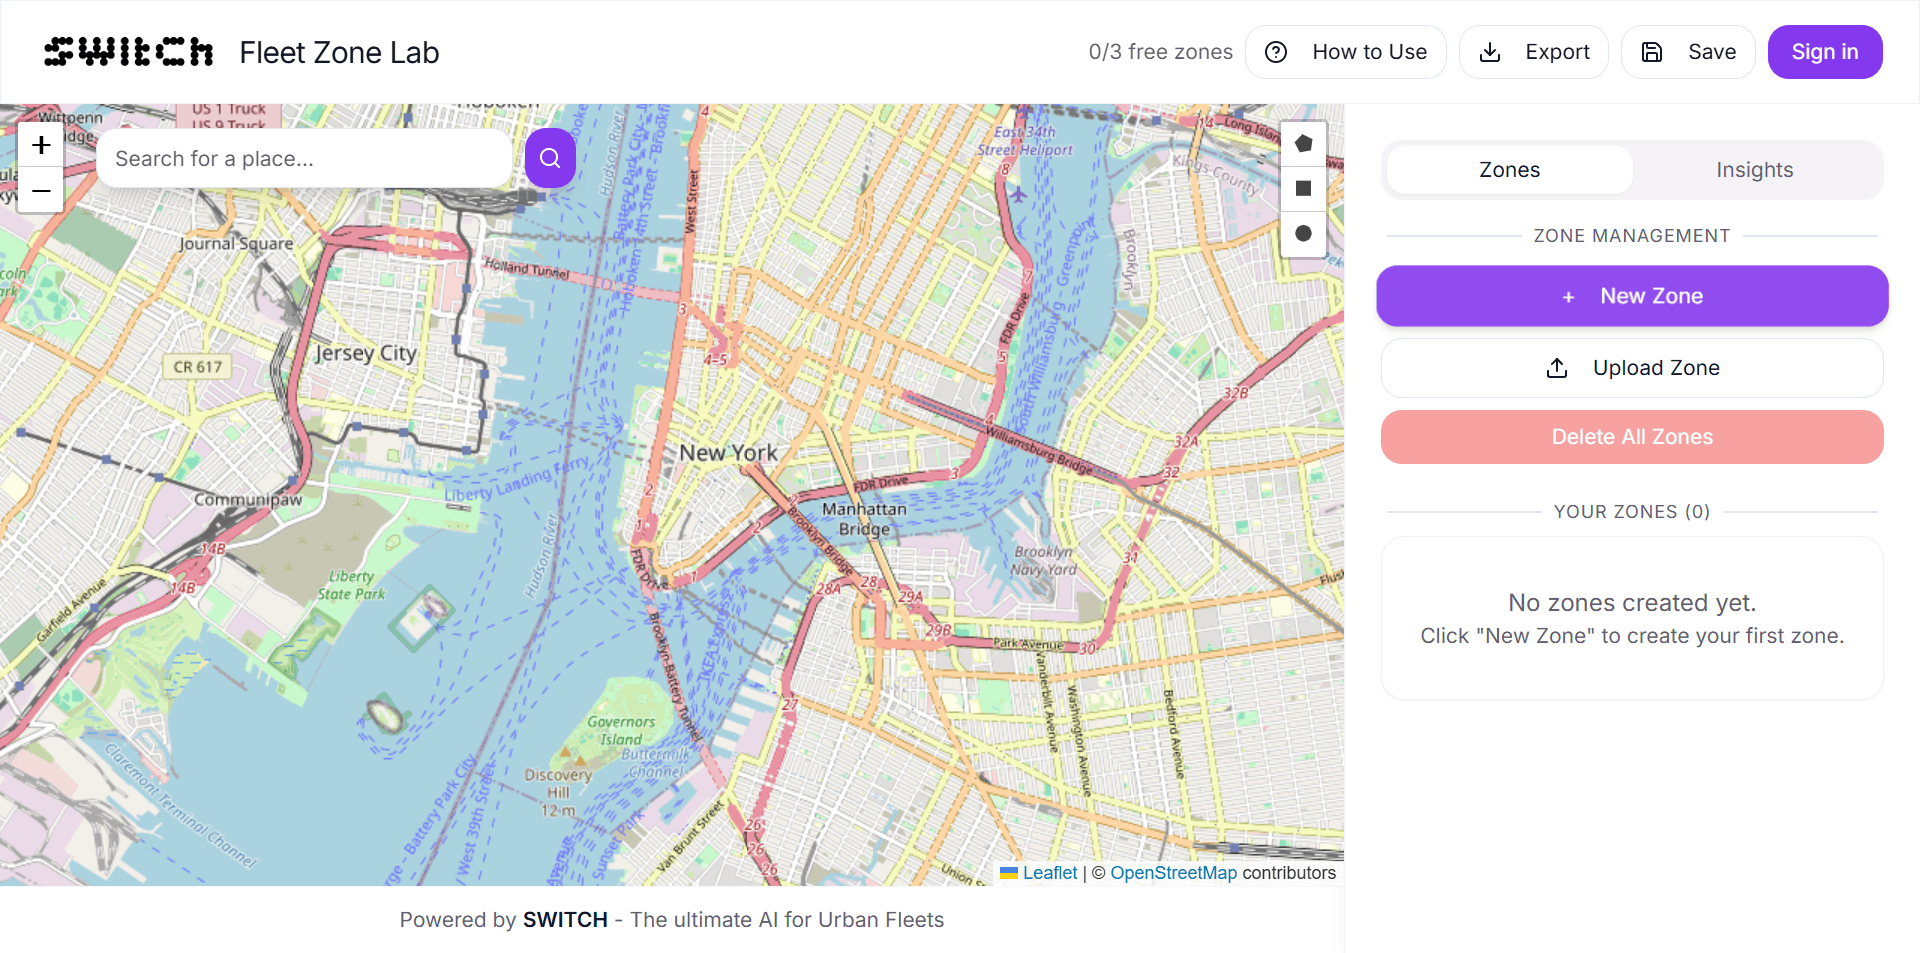
Step 2: Draw your zone or upload a file
Click the draw tool and click around the boundary of your area. Each click places a vertex. Close the shape by clicking the first point again, or double-clicking.
Alternatively, use the upload button to import an existing GeoJSON, KML, or Shapefile.
Step 3: Read the results
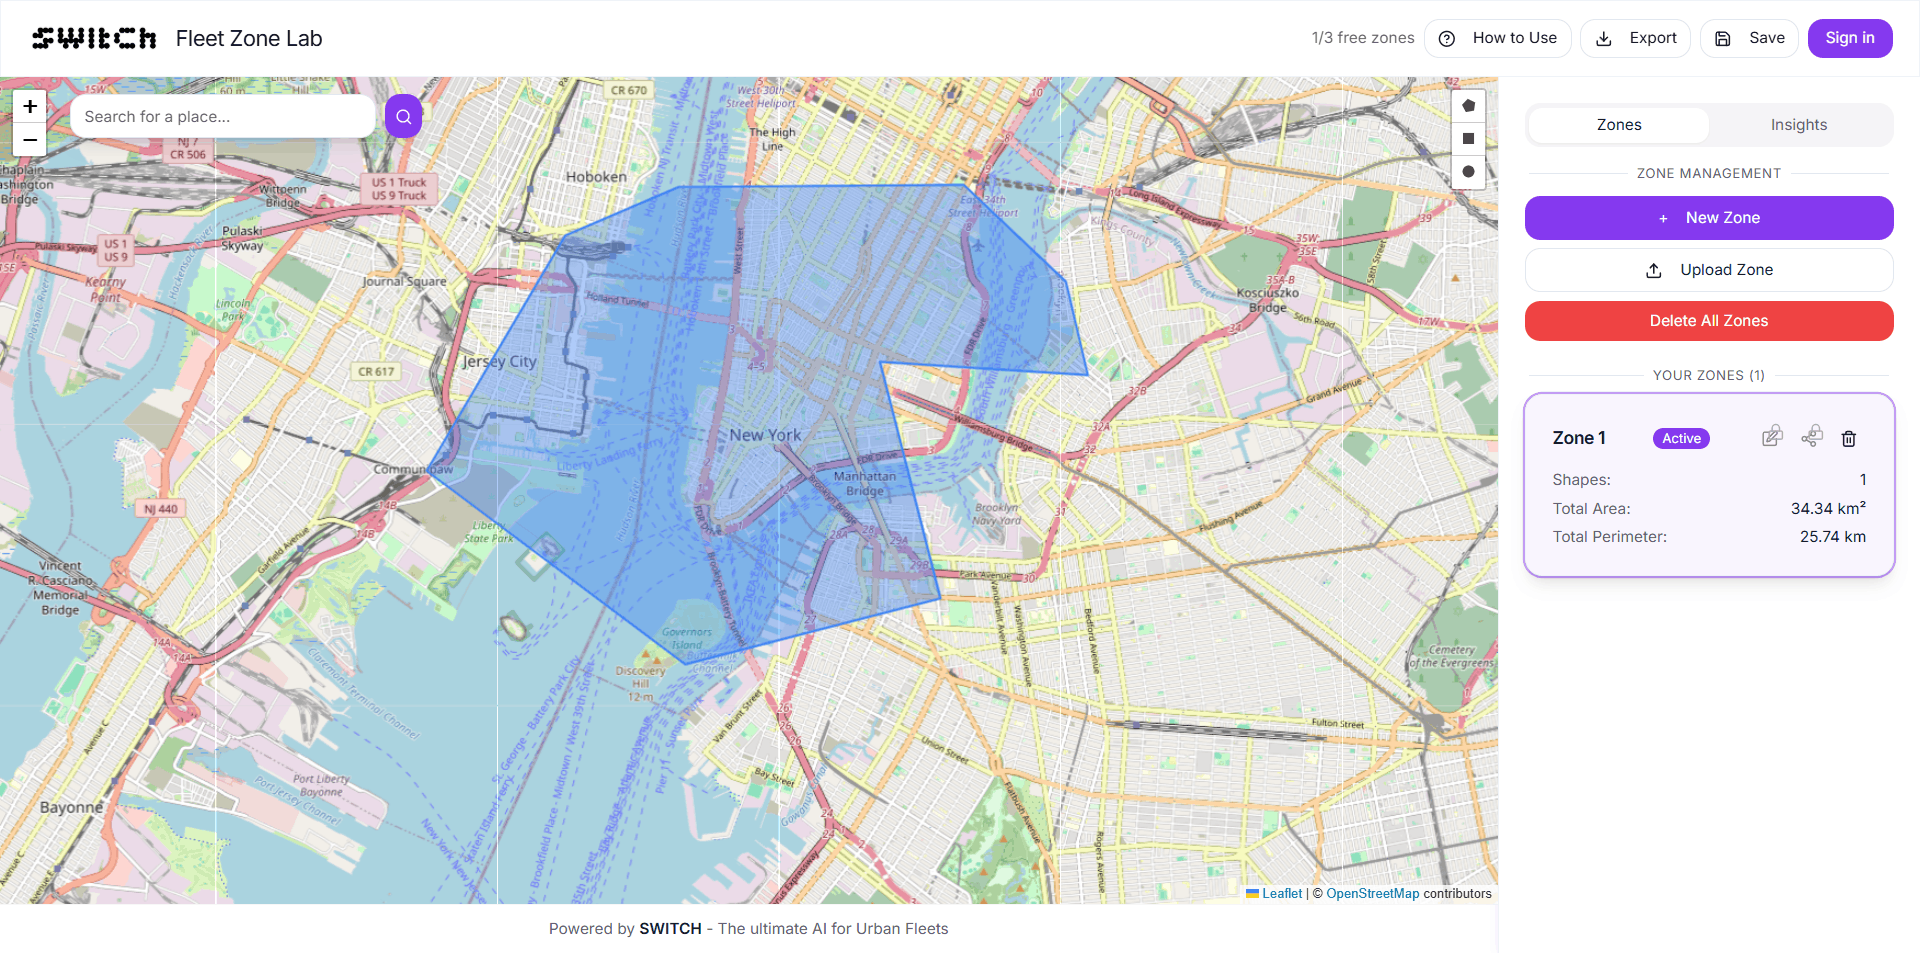
The moment you close the shape, the sidebar populates:
- Zone area in km²
- Perimeter in km
- Count of public transport stops inside
- Count of points of interest inside
- Count of EV charging stations inside
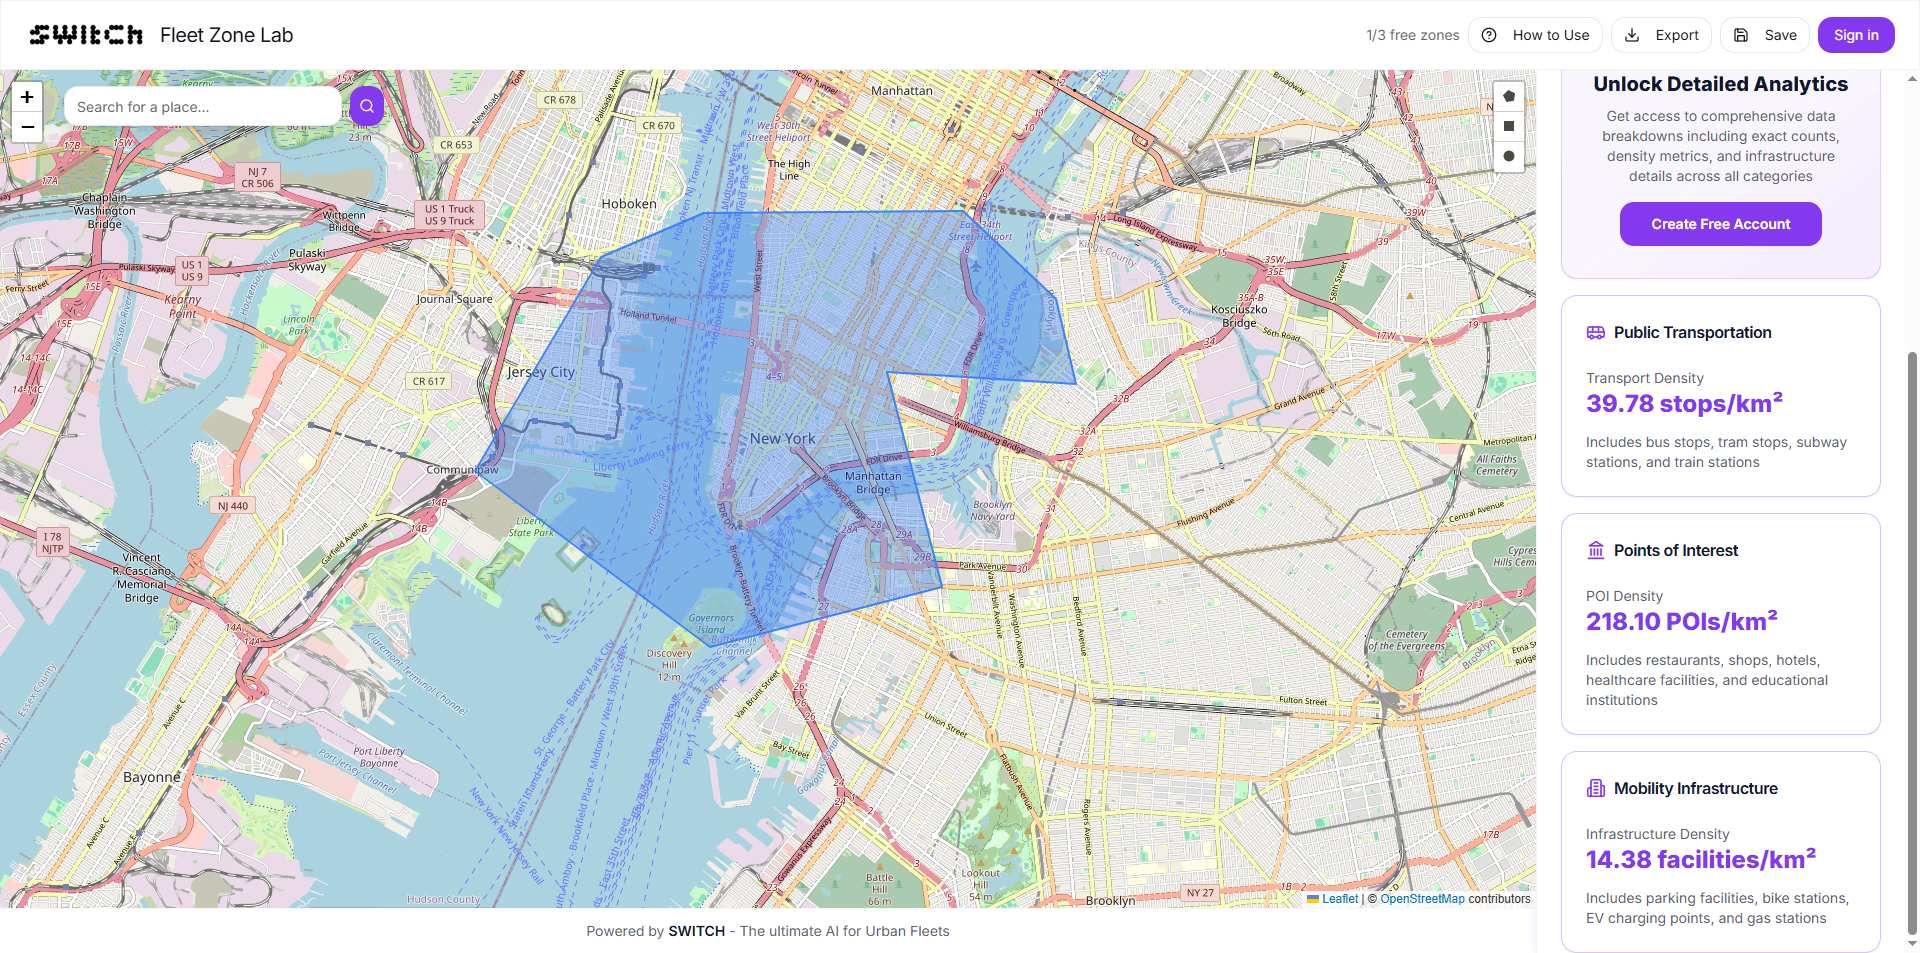
Step 4: Reshape, compare, or export
Drag any vertex to adjust the boundary. The metrics update instantly. To compare a different area, draw a second zone or clear the first.
To save your zone or export the data, register for a free account and unlock Detailed Analytics.
Frequently asked questions
Is Fleet Zone Lab really free? Yes. The core features, drawing zones, uploading files, and reading area, perimeter, and infrastructure metrics, are fully free with no account required. Detailed Analytics (data export, saved zones, deeper breakdowns) unlock after free registration.
What file formats can I upload? Fleet Zone Lab accepts GeoJSON, KML, and Shapefile formats. If your zone data is in one of these formats, you can upload it directly instead of drawing manually.
What infrastructure data does the tool show? The tool shows three categories: public transport stops (bus, tram, metro lines), points of interest (commercial and service locations), and EV charging stations (public charging points). Data is sourced from open datasets and updated regularly.
Does Fleet Zone Lab work outside Europe? Yes. The tool works globally, draw a zone anywhere on the map and the infrastructure analysis runs for that area. Data coverage may vary by region depending on open data availability.
How accurate is the data? The infrastructure counts reflect publicly available open data sources. They’re reliable for planning and analysis purposes, but should not be used as the sole input for operational decisions. Use Detailed Analytics for deeper context.
Can I save zones for later? Yes, with a free account. Registration unlocks the ability to save, reload, and share zones, as well as export data for reports.
What’s the difference between this and Google My Maps? Google My Maps lets you draw and annotate zones, but it doesn’t tell you what’s inside them. Fleet Zone Lab is purpose-built for infrastructure analysis: the moment you draw a zone, you get a live count of transport stops, POIs, and EV charging stations, something Google My Maps doesn’t do.
Is this the same as a GIS tool like QGIS? Fleet Zone Lab does a specific subset of what QGIS does, zone drawing and infrastructure density analysis, in a browser, with no installation and no learning curve. QGIS is more powerful but requires setup and expertise. Fleet Zone Lab is the right tool for fast, no-code geographic analysis.
Try it now
Open Fleet Zone Lab, draw your first zone, and read what’s inside.
No account needed to start. Register free to unlock Detailed Analytics and export your results.