
There are two different questions that sound the same but aren’t.
The first: “Where is the nearest EV charging station?” This is a navigation question. PlugShare, Chargemap, and Google Maps answer it well.
The second: “How much EV charging infrastructure exists within a specific area?” This is a planning question. It comes up when you’re deciding whether a district can support an electric vehicle fleet, evaluating a city for an EV-related service launch, or checking whether a zone has enough charging coverage to justify removing combustion vehicles from the rotation.
The apps designed for the first question don’t answer the second one. They show you pins on a map; not density within a boundary you define. This article is about the second question.
Why “nearest charger” apps don’t help with zone planning
PlugShare has over 600,000 charging locations globally. Chargemap covers most of Europe. The AFDC covers the US. These are excellent resources for EV drivers who need to charge right now.
For planning, they have a fundamental limitation: they show individual locations, not zone-level density. If you draw an irregular polygon around your operational area, a delivery district, a city borough, a campus, none of these apps will tell you how many chargers fall inside that boundary.
The closest most of them get is a radius search: “chargers within 5 km of this point.” A radius is not an operational zone. Your delivery area is not a circle. Your fleet’s service boundary is not centred on a single point. The mismatch between radius-based search and polygon-based operations is where the planning gap lives.
What EV charging density tells you
Charging station count within a defined zone is a useful number for three reasons.
It indicates market maturity. In cities and regions where EV infrastructure is dense, the transition to electric vehicles is already underway at scale. Charging is embedded in car parks, shopping centres, office buildings, and street infrastructure. Operating an EV fleet here is logistically feasible. In areas where charging is sparse, you’re operating ahead of the infrastructure, which may be intentional, but it’s a constraint you need to plan for.
It affects operational feasibility. For fleet vehicles that operate within a defined zone throughout the day, the number of accessible charging points inside that zone determines whether mid-shift charging is practical. A zone with ten charging points across 8 km² offers different flexibility than one with two.
It is a procurement signal. If you’re evaluating whether to electrify vehicles assigned to a specific territory, charging density inside that territory is a key input. You need to know the number before you can calculate whether the route works without a charging stop, or plan for one.
Who runs this analysis
The use case is broader than fleet management.
Fleet and operations managers evaluating electrification of a vehicle pool assigned to specific territories need a zone-level number, not a map of nearby pins.
Mobility startups launching EV-related services, shared charging, EV delivery, electric micromobility, use infrastructure density as an early signal of whether a city district is ready to support their model or whether they’d be building ahead of the market.
Urban planners and consultants working on electrification strategies and infrastructure gap analyses need to identify which zones are underserved. Density data for defined areas is the starting point for gap identification.
Site selection and real estate teams evaluating locations for EV-dependent businesses, logistics hubs, EV-centric retail, charging depot operators, treat charging density as a site scoring factor.
In each case, the question is the same: how many charging points exist within a boundary I define, not within a radius from a point I picked.
How to measure EV charging density in a custom zone
Step 1: Open Fleet Zone Lab
Go to area-analyst.getswitch.io. No account required to run the analysis.
Step 2: Draw or import your zone
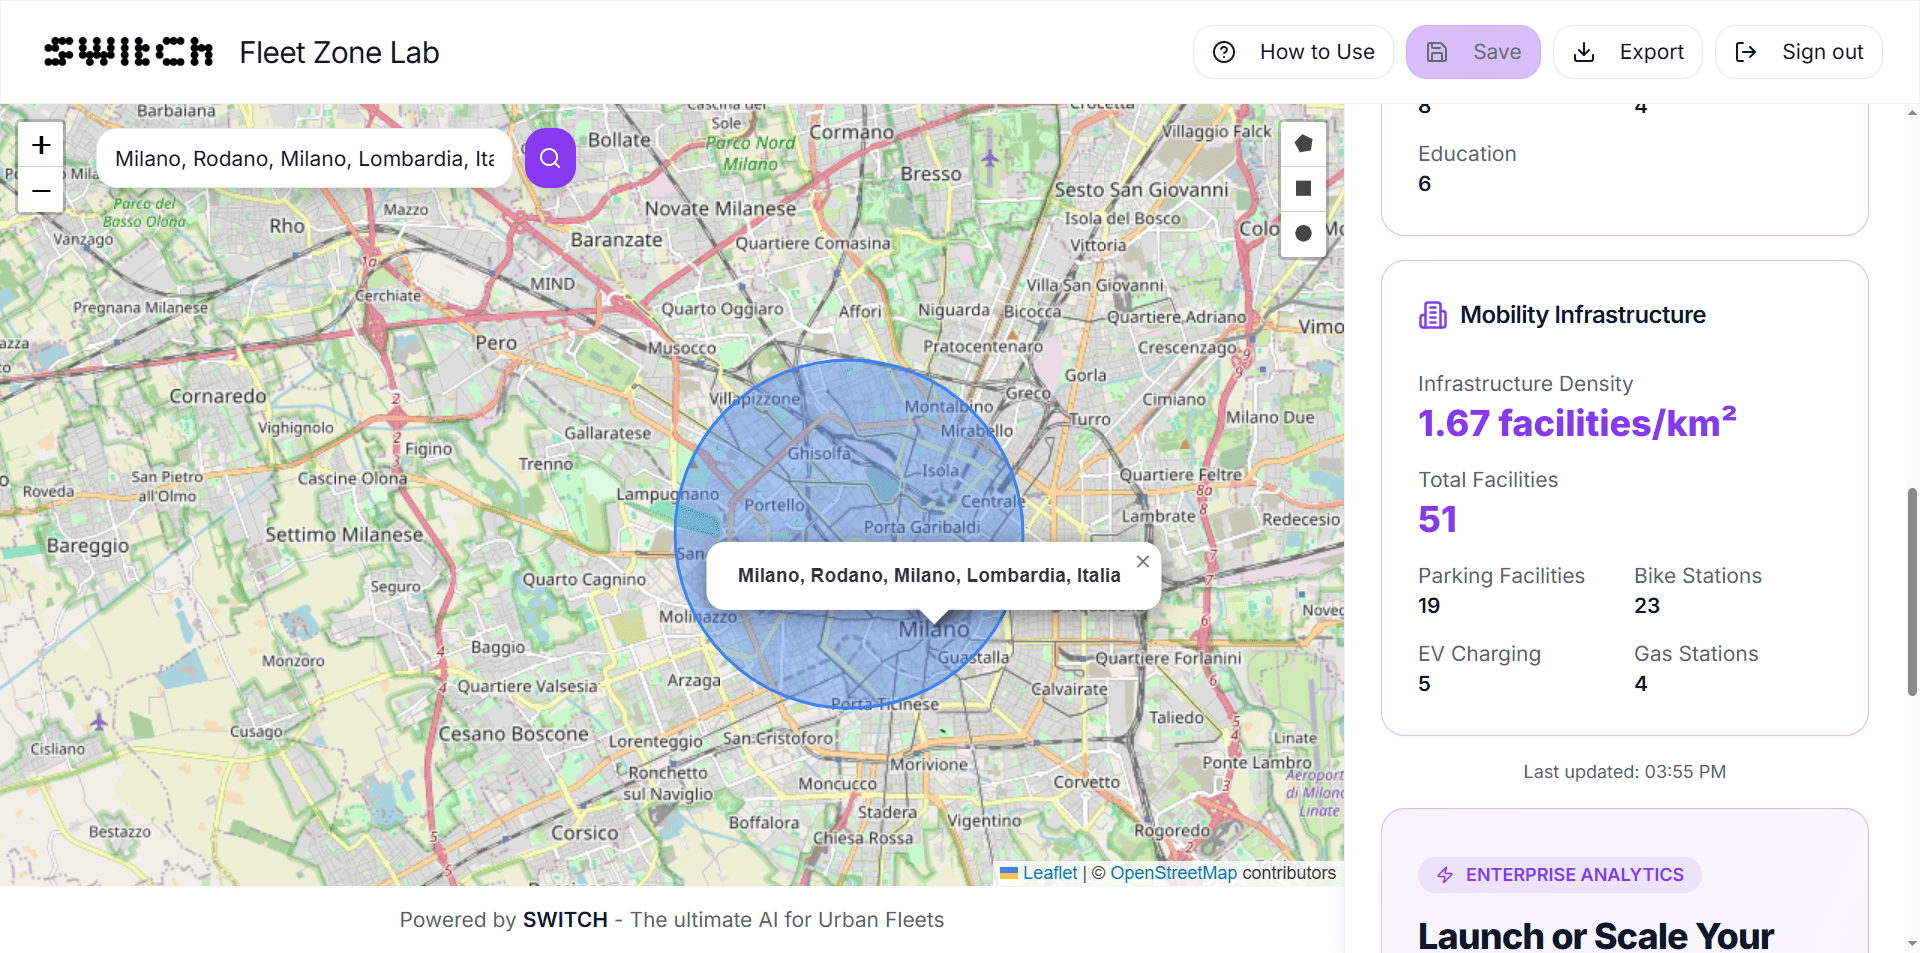
Use the polygon drawing tool to trace your area boundary on the map. Click to place each vertex; close the shape to complete it. Alternatively, upload an existing zone as a GeoJSON, KML, or Shapefile.
Step 3: Read the EV charging station count
Once the shape is closed, the sidebar shows the number of public EV charging stations inside the zone. This updates live as you adjust the boundary.
Step 4: Calculate density
Divide the charging station count by the zone area in km². This gives you EV charging stations per km², a comparable metric across zones of different sizes.
Example: a zone of 4.5 km² with 18 charging stations has a density of 4 stations/km². A neighbouring zone of 2 km² with 6 stations has a density of 3 stations/km². The first zone has fewer stations in absolute terms but higher density per km².
Step 5: Compare and iterate
Draw candidate zones side by side and compare the density numbers. Adjust boundaries to test whether including or excluding a specific block or corridor materially changes the infrastructure picture.
Reading the results
How to think about the count
The raw count tells you the total number of public charging points inside your zone. A higher count is not automatically better, it depends on zone size and vehicle count. Always normalise by area.
How to think about density
There is no universal benchmark for “sufficient” EV charging density, it depends on fleet size, shift patterns, vehicle range, and local charging behaviour. What you’re looking for is relative comparison: is Zone A meaningfully better than Zone B? Is the density high enough that mid-shift charging is operationally realistic, or is this a zone where vehicles would need to return to a depot for charging?
As a rough orientation for European urban areas: below 1 station/km² indicates a market in early infrastructure build-out; 2–5 stations/km² is typical of mid-maturity urban zones; above 5 stations/km² suggests a well-developed charging infrastructure in a dense urban area. These figures shift significantly by country and city.
What the count includes
Fleet Zone Lab draws from public EV charging station data. This covers publicly accessible charging points, street chargers, car park chargers, and destination chargers open to the public. It does not include private workplace chargers, residential chargers, or fleet depot chargers that are not publicly accessible.
Frequently asked questions
How do I check how many EV charging stations are in a specific area?
Draw your area in Fleet Zone Lab at area-analyst.getswitch.io. The tool shows the count of public EV charging stations inside any polygon you define, instantly, free, no account needed.
What is a good EV charging station density for an urban zone?
As rough orientation for European cities: below 1 station/km² is early-stage infrastructure; 2–5 stations/km² is typical of mid-maturity urban areas; above 5 stations/km² indicates well-developed charging coverage in a dense urban context. Thresholds vary significantly by country, city size, and fleet use case.
Does Fleet Zone Lab show fast chargers separately from slow chargers?
The free tier shows a combined count of public charging stations. Detailed Analytics (available with a free account) offer deeper breakdowns. For charger speed and type data, Open Charge Map and the AFDC provide filterable open data.
Can I use this to decide whether to electrify a vehicle fleet in a specific territory?
Yes, as a first-pass indicator. The charging station density inside your operational zone tells you whether public infrastructure exists to support mid-shift or opportunistic charging. Combine it with your vehicle range, shift patterns, and depot charging capacity to make the full assessment.
Does this work for areas outside Europe?
Yes. Fleet Zone Lab works globally. EV charging station data coverage is strongest in Western Europe, North America, and major Asian cities. In regions with less developed open data infrastructure, counts may be incomplete.
The number that changes the conversation
The question “is this zone ready for EVs?” usually gets a qualitative answer. It doesn’t have to.
Draw the zone. Read the charging station count. Divide by the area. You have a density figure that can go into a report, a procurement decision, or a market entry assessment, and it took five minutes to produce.
Check EV charging density in your zone free →
Draw your area, get the charging station count instantly. Register free to save zones, compare areas, and export results.